In recent months we have been looking into beef carcass trends and comparing how our cattle measure up to industry standards.
We started carcass testing in the late 1990s collecting both harvest and ultrasound data from our purebred herd. We do annual ultrasound testing on our bull crop at yearling time and collect kill data on females that don’t enter our breeding program. This data has proven to be a valuable tool in evaluating and affirming our goals.
We see a lot of carcass information made available by other seedstock producers, but unless it is followed up with meaningful explanations, it could be useless to you the customer. We have always taken pride in not only providing the data to our customers but also the understanding of how they can utilize the data to better their individual programs.
Currently, as marbling trends higher in the industry so does the potential loss of yield grade. Data collected on our home-raised cattle show that we have maintained a balance of both high quality grade (marbling/intramuscular fat) and high yield grade (less outer muscular fat/trim). We’ve long hoped that producers would have more opportunities to be directly rewarded for quality carcasses; as trends shift we believe that time is near. Producers can position themselves to take advantage of using not only superior growth genetics but also superior carcass genetics and be rewarded starting at the local auction market. Buyers will be asking “what are the genetics?” and you can be ready with an answer that they will pay more for!
We’ll share more about our most current data and the opportunities we’ve had a little later in this newsletter.
But first, we’d like to recommend the following resources penned by Charles Gracey, a respected industry analyst, to understand more about carcass merit as it relates to the Canadian cattle industry and to us as producers. We’ve selected excerpts from the following articles to give a foundation for our understanding.
Show us the money, Part 2: Balancing beef carcass quality and yield
By Charlie Gracey September 15, 2022
The cow-calf producer is primarily and rightly concerned with high reproductive performance and a healthy calf that grows rapidly until sold at weaning or later for feeding. But since cow-calf producers rarely get feedback, they can’t be expected to be much concerned about the grade and yield of the final product. And those who are concerned don’t have the information to do much about it. But most cattle feeders will know where the best cattle, as determined by grade and yield, come from.
The cattle feeder is concerned about quality because in many or most sales agreements, a premium is paid for Prime and AAA carcasses, and/or a discount for AA and A carcasses. To that end, as is now obvious, the feedlot operator often feeds the cattle to a considerable level of over-finish to ensure a Prime or AAA grade. The cattle feeder also desires feeder cattle that are healthy and growthy cattle based on a high degree of feed efficiency.
“Dressing per cent” is the ratio of carcass weight to live weight. The average dressing per cent of a fed steer or heifer is 60 per cent.
“Yield per cent” is the ratio of carcass cut-out to carcass weight and the average yield is 75 per cent. Thus, the average saleable yield from 100 pounds of live animal is (100 x 60 per cent x 75 per cent = 45 per cent.)
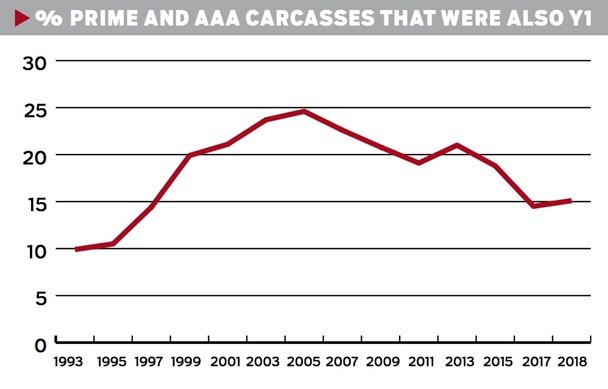
The price the industry is paying for virtually ignoring the yield issue is most evident in the chart above. The chart covers 1993 to 2021 and displays the per cent of carcasses that graded Prime or AAA and also were classified as Yield Class 1. It indicates that only about 10 per cent of carcasses met that condition in 1993. That is understandable since the previous system placed far too much emphasis on leanness. But over the next two decades, that percentage of high-quality, high-yield carcasses increased to nearly 25 per cent as the focus shifted to quality.
This chart is an excellent illustration of the biological tension that necessarily exists between quality and yield. The challenge for the industry is to find the right balance.
I suggest these conclusions from this data:
Producers at every level do not usually produce something they are not paid for. Hence little effort is made to produce high-yield carcasses, especially if it puts the quality grade at risk.
A high proportion of carcasses that are both of high quality and high yield is also the most efficient route that benefits producers and consumers alike.
Here is where I recall my editor naming this two-part series Show Us the Money. There is absolutely nothing wrong with having a high percentage of AAA and better carcasses, nor is there anything wrong with striving for high yield. The reason for the present situation is that producers are rewarded for the higher-quality grades while yield is essentially ignored.
There are two ways of ensuring high-quality carcasses. It is obvious that the main route has been through the feed trough, and that route is increasingly costly. The better route is to breed and select cattle that will produce high yield and high quality in the same carcass. This can be done — but not without supplying the breeder and cow-calf producer with grading data and market signals that they can use.
Carcass yield grades on the decline
By Charlie Gracey September 23, 2020
The revised grading system in 1993 followed an earlier system that placed far too much weight on leanness and not enough attention to quality. There was a requirement for at least a minimal amount of marbling but no standard higher than that. Thus when the new system was launched there was an immediate increase in the proportion of AAA and Prime carcasses.
This was not surprising because the grading system before 1993 was based primarily — I could say entirely — on leanness. This was not the intention and a little history is necessary to explain why.
Prior to 1972, when the first major change was made in the grade standard, the industry was labouring under the burden of excess body fat on fed cattle. It was generally believed that heavy fat cover was necessary to ensure quality. So, a system was introduced that was based on fat thickness as measured at the point between the 11th and 12th rib. This required “ribbing” of the carcass and for the first time the grader, packer and beef buyer got to see the cut surface of the Longissimus dorsi muscle and were able to measure the fat thickness.
For fed cattle four grades were provided: Canada A1, A2, A3 and A4. A1 carcasses were those with a fat thickness of five to 10 mm. (I am converting from fractions of an inch to millimetres for the sake of consistency). A2 carcasses were those with 11 to 15 mm. A3 were those with 16 to 20 mm and A4 included carcasses with 21 mm or more of fat cover. There were slight variations based on carcass weight but the above is sufficient for this discussion.
Carcasses were required to have a minimal degree of marbling but as time passed less and less attention was paid to marbling. I can state this because the destination of insufficiently marbled carcasses was the Canada C grade and as the years went by fewer and fewer carcasses were graded C. This trend was so strong that the C grade was not included in the new grading system introduced in 1993.
Simply because the leanest carcasses were graded A1, the perception grew that this was the top grade. This was not the intent but the designers, including me, naively intended that we would simply describe the carcass fatness and let the trade determine their own preferences. This was not the case and the A1 grade became the dominant grade.
By the early 1990s it became all too evident that beef quality was declining and that a new system was necessary to reintroduce quality characteristics in the form of varying levels of marbling. The planners then decided, quite rightly, that the industry needed a dual grading system that was to categorize each carcass as to both its quality and yield.
That explains why Triple A carcasses represented less than 20 per cent of the total in 1993. The entire industry had been focused so long on leanness, and therefore yield, that most carcasses were poorly marbled. That was about to change.
From 1993 onward, AAA carcasses grew steadily. In 1997, we introduced the Canada Prime grade. The combination of Canada Prime and Canada AAA broke through the 40 per cent level in 1997, passed the 50 per cent level in 2009 and went above the 60 per cent level in 2015.
If this were the only story to tell it would be a wonderful story indeed. But it isn’t!
Yield declines
As quality advanced, yield declined. The decline was not as dramatic as was the increase in AAA carcasses, so it looked like the industry was improving quality while maintaining high yield simultaneously. This was true until about 2005.
However, from 2005 onward the proportion or Y1 carcasses began a steady decline, which you can see in the yield class chart. Because the five-class yield system was introduced in 2019, this chart ends in 2018, as comparisons with 2019 data would be misleading. This applies as well to the chart showing the proportion of carcasses that were Prime or AAA as well as Y1.
It is not necessary to argue that the best carcasses, for most purposes, are those that combine high quality with high yield. So, the obvious question is, what percent of carcasses were graded both AAA or better and were also Y1?
From 1993 to 2005 there was a steady increase from just 10 per cent of carcasses to a peak of 25 per cent that met those standards. Twenty-five per cent may be a disappointingly low number, but it at least proves that producing carcasses that are of both high quality and high yield is entirely possible. Furthermore, this was accomplished without any price signal that high yield was desirable.
But instead of building on this progress, emphasis has shifted strongly to focus on quality and the percentage of carcasses that combined best quality with best yield commenced a long decline. In 2018 fewer than one carcass in six graded as both AAA or better for quality and Y1 for yield.
Broadly speaking, the industry pays little or no attention to the lean meat content of a carcass. This is surprising when the most basic purpose of the entire industry is the production of high-quality muscle meat. But this is not surprising when there are no obvious price signals at any level in the production chain that would reward cattle feeders and cow-calf producers for producing a higher proportion of high-quality and high-yielding carcasses.
Stated more bluntly, the industry today is producing a product that is inferior to what was accomplished 15 years ago.
Another reason to pay more attention to yield is that feed costs rise rapidly after cattle reach the optimal finishing level. For an industry striving for sustainability and searching for profit, feed efficiency is important.
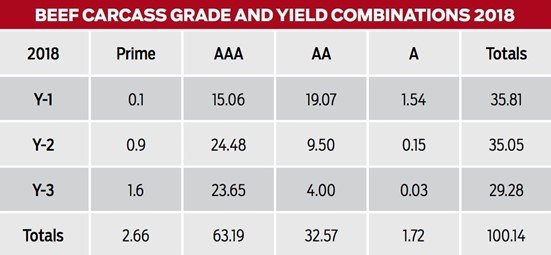
Since we now have a dual grading system, albeit in name only, it would be a good idea to present grading data in that format. The tables below showing grade and yield combinations for 2005, 2018 and 2019 do just that. I present the 2018 data because it is more comparable with the 2005 chart as both are based on the original three yield classes. The 2019 table is, of course, based on five yield classes.
That concludes the excerpts from Charles Gracey’s articles.
It’s up to the producer to decide for themselves what kind of cattle they want to produce. Most cattlemen we know take pride in the cattle they raise; they strive for the best and want to be rewarded for their efforts.
While producing sound, functional cattle that are pleasing to the eye, we as producers can also work toward superior performance in both growth and carcass traits. Over the years, we at Rawes Ranches have maintained a balance in all stages of the production cycle. Even though industry data has shown yield has trended down, we have maintained high yield in our cattle, shown in the data below.
Grading information on 172 head of our 2021 born purebred finished heifers show:
Quality Grade: 97.67% graded AAA
Yield Grade: 70.35% graded Y-1 & Y-2
Combined: 68.02% graded both AAA and Y-1 & Y-2
Comparing our data to the 2019 industry data above, circled in green showing 30.99% of beef carcasses having AAA and Y-1 & Y-2 yield grade, it is an affirmation that our results are good results!
When producers have quality genetics in their herd, they can take advantage of opportunities in the market as they arise.
This past year, we had the opportunity to sell our home-raised finished cattle into a program that paid a premium but required high quality grade. We were able to take advantage of this opportunity because we had the built-in genetics ready to go. You can too!
Breed by design, not by accident!


